
What Is Sea-Level Rise?
Sea-level rise refers to the long-term increase in the average height of the ocean's surface relative to the land. Scientists track two distinct measures: absolute sea level, which describes the actual volume of water in the ocean, and relative sea level, which accounts for whether the land itself is sinking or rising. Both matter enormously for understanding real-world flooding risk.
Modern measurements come from two complementary systems. Tide gauges - instruments anchored to coastlines - have recorded local water heights for well over a century. Since the early 1990s, satellite altimeters have provided near-global coverage, measuring the ocean surface from orbit with millimeter-scale accuracy. Together, these tools give scientists a remarkably detailed picture of how and where the ocean is changing.
~21 cm
Global sea-level rise since 1900
According to IPCC Sixth Assessment Report estimates, global mean sea level rose approximately 20-23 cm between 1901 and 2018.
~4 mm/yr
Current annual rate of sea-level rise
Satellite altimetry data since 1993 shows the rate of global mean sea-level rise has roughly doubled compared to the 20th-century average.
Up to 1.0 m
Projected rise by 2100 (high emissions)
The IPCC AR6 projects 0.6-1.0 m of global mean sea-level rise by 2100 under a high greenhouse-gas scenario, with higher outcomes possible.
The Two Primary Drivers: Thermal Expansion and Ice Loss
Two physical processes account for the overwhelming majority of observed sea-level rise.
Thermal Expansion
Water expands as it warms - a property known as thermal expansion (or steric sea-level rise). As the ocean absorbs excess heat trapped by greenhouse gases, its volume increases even without any additional water mass entering it. Estimates suggest thermal expansion has contributed roughly a third to a half of 20th-century sea-level rise, and its share is expected to grow as deeper ocean layers continue warming.
Melting Land Ice
When ice stored on land - in glaciers and ice sheets in Greenland and Antarctica - melts and flows into the ocean, it adds real mass and volume. This is categorically different from sea ice (frozen ocean water), which has negligible effect on sea level when it melts, much like ice cubes melting in a glass. Greenland's ice sheet alone holds enough frozen water to raise global sea level by approximately 7 meters if it were to melt entirely, though that scenario would unfold over centuries to millennia under any plausible scenario.
Understanding how ocean circulation interacts with warming helps explain why heat doesn't distribute evenly - and why ice loss rates differ between the Atlantic and Pacific sides of major ice sheets.
Why Sea Levels Don't Rise Equally Everywhere
One of the most counterintuitive findings in sea-level science is that the ocean surface is not flat, and it doesn't rise uniformly. Several forces create dramatic regional differences.
Gravitational Effects of Ice Sheets
Large ice masses exert a gravitational pull on surrounding ocean water, drawing it toward them. When an ice sheet loses mass, that gravitational attraction weakens, and water actually retreats from the nearby ocean - while redistributing toward distant coastlines. Paradoxically, sea-level rise from Greenland ice loss is felt most strongly along the coasts of the southern United States and the southern hemisphere, far from Greenland itself.
Ocean Circulation and Wind Patterns
Wind-driven ocean currents pile water up in some regions and draw it down in others. Changes in large-scale circulation patterns - including those linked to phenomena like El Niño - can shift sea level by centimeters across entire ocean basins within months.
Land Subsidence
In many coastal areas, the land itself is sinking due to natural sediment compaction, groundwater extraction, or the slow rebound from ancient ice sheet removal. Cities like Houston, New Orleans, and Jakarta are subsiding faster than the global average sea-level rise, dramatically compressing the effective timeline of flood risk for their residents.
Current Rates and Projections
Global mean sea level rose at roughly 1.3-1.7 mm per year through most of the 20th century. Since satellite measurements began in 1993, the rate has accelerated to approximately 3.6-4.0 mm per year. The Intergovernmental Panel on Climate Change (IPCC) Sixth Assessment Report projects that under a high greenhouse-gas-emission scenario, global mean sea level could rise between 0.6 and 1.0 meters by 2100 relative to a 1995-2014 baseline - with the possibility of higher outcomes if ice sheet instabilities are triggered.
These projections carry genuine uncertainty, particularly regarding the behavior of the West Antarctic Ice Sheet, which rests on bedrock below sea level and could be vulnerable to runaway retreat. Scientists describe this as a marine ice sheet instability - a process that, once initiated, may be difficult to slow. This remains an area of active research rather than settled science, and projections at the higher end of the range depend heavily on how this system responds to continued warming.
What This Means for Coastal Communities
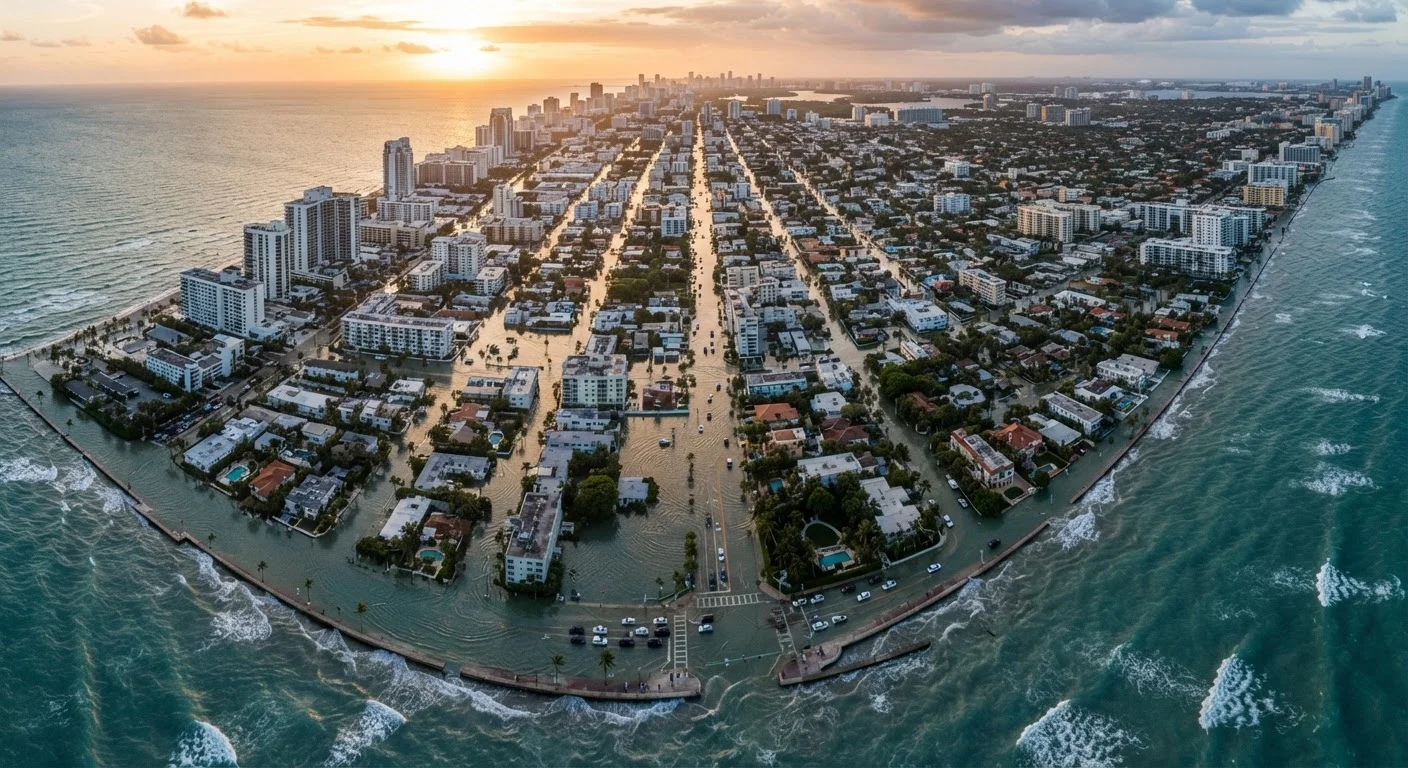
Even a modest rise in baseline sea level dramatically increases the frequency of what were once rare flood events. A storm surge that historically caused a 1-in-100-year flood may, in a world with 30 cm more sea level, become a 1-in-10-year or 1-in-5-year event - without any change in storm intensity. This phenomenon, sometimes called nuisance flooding when it occurs during high tides alone, is already measurable in cities like Miami, Annapolis, and Charleston.
Planning for this reality requires understanding local sea-level projections, not just global averages. A community built on subsiding deltaic sediment faces compounding pressures that a rocky, tectonically stable coastline does not. Federal agencies, including NOAA, publish regional sea-level rise scenarios to help planners and engineers design with appropriate margins. This general science education is not a substitute for professional engineering or emergency management guidance tailored to specific localities.
This article is for general informational and educational purposes only. For site-specific flood risk assessment or coastal engineering decisions, consult qualified professionals and authoritative regional agencies.